
August 11, 2025 3:35 pm Leave your thoughts
In 2024, nearly half of all American renter households, more than 21 million, were officially classified as cost-burdened, meaning they spent over 30% of their income on housing. This analysis projects where that burden will be lowest over the next decade and identifies the metropolitan areas expected to offer financial relief in a nation with rising living costs.
Key Findings
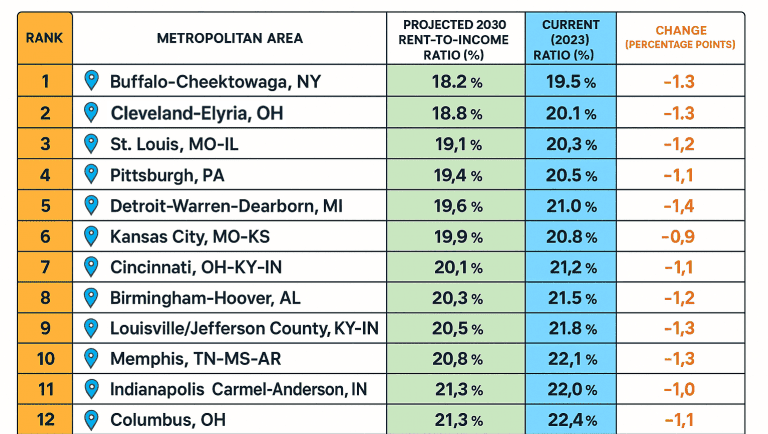
• Most Affordable City for Renters in 2030: Based on the report’s projections, Buffalo, New York, is expected to be the most affordable U.S. metropolitan area for renters by 2030, with a projected rent-to-income ratio of 18.2%.
• Geographic Center of Affordability: The Midwest and older industrial cities in the Northeast and Rust Belt lead the rankings. Cities such as Buffalo, Cleveland, St. Louis, and Detroit combine lower housing costs with stabilizing economies, in sharp contrast to the overheated Sun Belt markets that drove growth in the previous decade.
• Core Drivers of Affordability: The most affordable cities do not always have the lowest rents, but they maintain the best balance between rental costs and local renter incomes. These areas see moderate, steady wage growth and a housing supply that has kept pace with demand, helping prevent the severe price spikes seen in other regions.
• Primary Risk to Future Affordability: The greatest threat to these affordable areas is induced demand, the risk that their popularity, driven by affordability and quality of life, will draw more residents than new housing construction can support. This could strain infrastructure and reduce the affordability that made them appealing.
• National Outlook: The national median rent-to-income ratio for renters is projected to stay high, reaching 29.1% in 2030. Although this is a slight improvement from the current cost-burden threshold, it shows that for the average renter, affordability will still be a major challenge, making location choice more important than ever.
A Looming Crisis for American Households
In the United States, the housing affordability standard set by the U.S. Department of Housing and Urban Development (HUD) says households should spend no more than 30% of their gross income on housing costs. Households spending more are considered “cost-burdened.” U.S. Census Bureau data shows that in 2023, 49.7% of the nation’s 42.5 million renter households were in this position. That equals more than 21 million households, the highest number ever recorded, according to a report from the Joint Center for Housing Studies of Harvard University cited by NerdWallet.
This crisis stems from a widening gap between rental costs and local wages. Both have increased, but not at the same pace. Between the 2014–2018 and 2019–2023 five-year periods, the national median gross rent, which includes utilities, rose by about $100. In the same period, inflation-adjusted median household income grew only 7%, according to the Census Bureau. Inflation made this gap worse. The Bureau of Labor Statistics reported in its 2023 Consumer Expenditure Survey that housing prices climbed 7.5%, which was the main factor behind the year’s overall 4.1% inflation rate.
The result is a long-term affordability problem in which rental prices are driven more by national investment trends and market pressures than by what local workers can afford. Because of this, looking at “low rent” alone does not show whether housing is truly affordable over time. The better measure is the rent-to-income ratio, which shows the actual financial strain on a household. This report uses forecasts of that ratio to identify the cities where renter incomes are most likely to keep up with housing costs through 2030.
2030’s Most Affordable Places to Rent
The culmination of this analysis is the 2030 Renter Affordability Index, which ranks U.S. metropolitan areas by their projected rent-to-income ratio. The cities at the top of the list represent areas where the economic fundamentals, namely the relationship between housing costs and renter earnings, are expected to be the most favorable in the nation. These are not only the cheapest places to live but also where a renter’s paycheck is likely to stretch the most.
The table below presents the full ranking for the top 12 metropolitan statistical areas.
Exploring the Most Affordable Metros
1. Buffalo, New York
Buffalo has moved from a declining industrial hub to a metro with a balanced economy in manufacturing, education, and health services. Affordable housing and stable incomes have kept rent growth in check. The Federal Reserve Bank of New York notes that job growth is modest, but median household income is keeping pace. The region’s challenge is to add new development while protecting long-term residents, which will require active city and county policies.
- Unemployment Rate (May 2025): 3.2%
- Key Industries: Health Care, Education, Manufacturing
- 10-Year Population Growth: +1.7% (2013–2023)
- FEMA Risk: Relatively Low (Erie County)
2. Cleveland, Ohio
Cleveland’s housing supply and shift toward healthcare and finance have helped keep rents affordable. Major employers like the Cleveland Clinic and University Hospitals drive steady wages. Population loss remains a concern, especially as the city works to attract workers for its growing health-tech sector.
- Unemployment Rate (May 2025): 4.8%
- Key Industries: Healthcare, Manufacturing, Finance
- Population Change (2022–2023): -0.77% (City)
- FEMA Risk: Relatively Low (Cuyahoga County)
3. St. Louis, Missouri
St. Louis combines low housing costs with an economy anchored by healthcare, manufacturing, and eight Fortune 500 companies. A Regions Bank report says job growth is slow, but the financial sector matches national averages. Continued out-migration could weaken long-term growth unless addressed.
- Unemployment Rate (May 2025): 3.7%
- Key Industries: Healthcare, Financial Services, Manufacturing
- Population Change (2020–2023): Negative
- FEMA Risk: Moderate (St. Louis County)
4. Pittsburgh, Pennsylvania
Pittsburgh has shifted from heavy industry to a leader in tech and healthcare, supported by Carnegie Mellon and UPMC. A Construction Coverage report shows rent growth is strong, but affordability remains due to a low starting point. Maintaining housing supply is key to balancing its tech growth.
- Unemployment Rate (May 2025): 3.5%
- Key Industries: Healthcare, Technology, Education, Finance
- Population Change: Stable to modest growth
- FEMA Risk: Relatively Low (Allegheny County)
5. Detroit, Michigan
Detroit’s recovery includes diversifying beyond autos into technology and logistics. A University of Michigan forecast projects city wages outpacing state averages, supported by a low-cost housing market. Persistent unemployment and ensuring residents benefit from job growth remain priorities.
- Unemployment Rate (May 2025): 5.6%
- Key Industries: Automotive, Advanced Manufacturing, Technology
- 10-Year Population Growth: +0.5% (11-County Region)
- FEMA Risk: Relatively Low (Wayne County)
6. Kansas City, Missouri
Kansas City’s economy is broad, with no sector exceeding 15% of employment. The Missouri Economic Research and Information Center reports wages above $60,000 in 2023, supporting strong purchasing power. This diversity supports affordability despite a high FEMA risk rating.
- Unemployment Rate (May 2025): 3.8%
- Key Industries: E-commerce, Engineering, Government, Healthcare
- Population (2023): 1,222,158
- FEMA Risk: High (Jackson County)
7. Cincinnati, Ohio
Home to Procter & Gamble and Kroger, Cincinnati benefits from a stable corporate base and rising demand. Redfin data shows rent growth is high, but starts from a low baseline. Expanding the housing supply will be important to keep it affordable.
- Unemployment Rate (May 2025): 3.7%
- Key Industries: Consumer Goods, Healthcare, Finance
- Population Change: Stable to modest growth
- FEMA Risk: Relatively Low (Hamilton County)
8. Birmingham, Alabama
Birmingham has replaced its steel economy with bioscience, banking, and tech. A Regions Bank analysis says a high homeownership rate helps keep rental pressure low. Slower labor force growth is a concern for meeting future demand in high-tech fields.
- Unemployment Rate (May 2025): 2.6%
- Key Industries: Bioscience, Finance, Advanced Manufacturing
- Median Household Income (2019–2023): $44,376 (City)
- FEMA Risk: Relatively High (Jefferson County)
9. Louisville, Kentucky
Louisville’s mix of manufacturing, healthcare, and logistics anchors its economy. Redfin data shows asking rents have dipped slightly, showing a balanced housing supply. Wage growth from large employers supports long-term affordability.
- Unemployment Rate (May 2025): 3.6%
- Key Industries: Logistics, Manufacturing, Healthcare
- Median Asking Rent (June 2025): $1,269
- FEMA Risk: Moderate (Jefferson County, KY)
10. Memphis, Tennessee
Memphis is a global logistics hub anchored by FedEx and major transportation networks. A Money Crashers analysis reports low average rents of $788, helping maintain affordability. Greater economic diversity is needed to lift median incomes.
- Unemployment Rate (May 2025): 3.8%
- Key Industries: Logistics, Transportation, Healthcare
- Median Asking Rent (June 2025): $1,285
- FEMA Risk: Relatively High (Shelby County)
Rent and Income Projections for the 2030 Market
This report uses a proprietary forecasting model to identify the most affordable U.S. cities for the next decade. It projects median gross rent and median renter household income for Metropolitan Statistical Areas (MSAs) through 2030. The model relies only on publicly available data from federal agencies and trusted private sector sources for transparency and replicability.
Rent Projection Model
The model uses four main data layers:
- Baseline Rent
The model starts with the U.S. Census Bureau’s American Community Survey (ACS) data on Median Gross Rent (Table B25064). The 2019–2023 5-Year Estimates provide broad coverage. For MSAs with populations over 65,000, these figures are updated with 2023 1-Year Estimates for a more current picture of rental costs. - Market Velocity
To capture current market conditions, the model includes high-frequency data from Zillow’s Observed Rent Index (ZORI) and Redfin’s Median Asking Rent data. A critical part of this layer is the “volatility spread,” the difference between Redfin’s asking rent for new listings and Zillow’s index of all rents, including existing leases. A large negative spread, where asking rents drop faster than overall rents (as in Austin), signals a likely market peak and predicts declines in median rent. A positive spread suggests upward pressure. This metric is applied as a short-term directional adjustment to the forecast. - Supply-Side Pressure
The housing supply pipeline influences future rent growth. The model uses new residential building permit and housing completion data from the Census Bureau’s New Residential Construction survey and the National Association of Home Builders (NAHB). In cities with high volumes of multifamily construction, as identified in Redfin analyses, a “dampening factor” reduces projected rent growth to account for potential vacancies and landlord concessions. This supply glut has two outcomes. If local governments, such as those in Austin or San Antonio, do not align zoning reforms with new construction, developers may focus on luxury units. This can leave the affordability crisis for middle-income renters unresolved, even with more total housing. - Demand-Side Pressure
Demand is modeled using population trends. The forecast draws on the Census Bureau’s Vintage 2024 population estimates for recent migration data and uses long-term projections from the Weldon Cooper Center for Public Service. Metros with steady in-migration are expected to see faster rent growth.
The Renter Income Projection Model
| Component | Description |
|---|---|
| Baseline Renter Income Establishment | The model begins with the 2023 Median Household Income for Renter-Occupied Units. This figure is not directly published for all MSAs by the Census Bureau, so it is derived from the ACS Public Use Microdata Sample (PUMS) files. This approach follows the methodology used by housing researchers at the National Multifamily Housing Council (NMHC Data Download). |
| Historical Income Growth Analysis | The historical Compound Annual Growth Rate (CAGR) of income is calculated for each MSA using U.S. Bureau of Economic Analysis personal income data by metropolitan area (BEA Personal Income Data) and Bureau of Labor Statistics data on over-the-year changes in average weekly earnings for large metropolitan areas. This step establishes localized, long-term wage growth patterns. |
| Macroeconomic Growth Constraints | Local income growth projections are adjusted using national economic forecasts to ensure they remain realistic. Constraints are based on the Congressional Budget Office’s March 2025 Long-Term Budget Outlook (CBO Outlook), which forecasts real GDP growth slowing to below 2% annually after 2026 and inflation stabilizing around 2%. This acts as a national governor on the model. If local wages fail to match these modest projections, municipalities may be forced to either cut public services, as happened in Detroit, or raise property taxes, which could burden both renters and homeowners and increase the risk of out-migration. |
Cities to Watch: The Up-and-Comers
These metropolitan areas are not in the top 10 for 2030, but they are projected to see the largest improvement in the rent-to-income ratio over the next six years. They are emerging markets where wage growth is starting to exceed rent increases.
San Antonio, TX: While many Texas metros have faced affordability problems, San Antonio has kept a more balanced market. Its diverse economy, anchored by military, healthcare, and tourism, provides a stable employment base. Rent growth is expected to remain more moderate than in Austin or Dallas, while income growth stays strong. This positions the city to become one of the most affordable large metros in the Sun Belt.
Richmond, VA: As a state capital with a growing financial services sector and proximity to Washington, D.C., Richmond attracts talent without the extreme housing costs of the nation’s capital. The economy is strong, and the housing market, though expanding, has not experienced the steep price increases seen in other East Coast cities.
Indianapolis, IN: With a strong presence in life sciences, technology, and logistics, Indianapolis is steadily building a high-wage economy. The housing market remains one of the most affordable among large Midwest metros. As its high-tech sectors mature, income growth is expected to accelerate, improving the rent-to-income ratio.
Affordability Traps: The Markets Facing Headwinds
In contrast, some cities seen as affordable today are likely to be far less so by 2030. In these areas, projected rent increases outpace income growth, creating future affordability pressure.
• Boise, ID: Once known for affordable living, Boise has grown rapidly. Construction Coverage data shows rents are projected to rise 32.1% in 2025. Housing demand from out-of-state migration is rising faster than local wages, putting Boise on track to become one of the West’s more cost-burdened cities.
• Phoenix, AZ: Phoenix has attracted steady population growth for years, but at a cost. HUD data in news reports shows a 33% jump in Fair Market Rents for FY2023. Even with a growing economy, housing costs are climbing faster, cutting into its past affordability advantage.
• Austin, TX: Redfin data shows asking rents dropped 5.7% year-over-year due to an oversupply of new apartments, but the long-term trend is still concerning. Popularity has pushed housing costs well above local median incomes. Once the extra supply is absorbed, rent growth will likely rise again, while most of the high-tech job boom benefits stay with high earners.
Rental Affordability: Opportunities and Risks
Changes in rental affordability influence where people live, how cities plan, and which policies governments prioritize. The data shows not only where affordability exists but also how it can be created and maintained.
For Renters: The Rise of Geographic Arbitrage
Remote and flexible jobs make it easier for workers to relocate from high-cost, low-affordability areas to lower-cost cities, increasing disposable income and improving quality of life. Redfin data shows people leaving expensive coastal cities like Los Angeles and New York for more affordable destinations. This movement brings challenges.
Higher-earning newcomers can accelerate gentrification and raise housing costs for long-time residents. Cities such as Kansas City and Buffalo can address this by working with groups like the Mid-America Regional Council or the Erie County Planning Department.
For Cities: Affordability as an Economic Development Tool
For cities at the top of the affordability rankings, low housing costs are a competitive edge in attracting talent. The National League of Cities notes that stable, affordable housing supports local businesses by keeping a steady workforce and giving residents more spending power, which strengthens the tax base.
Cities that protect and promote affordability can draw both residents and employers. This calls for cooperation between economic development departments and housing authorities to treat affordability as a long-term asset.
For Policymakers: Tools to Maintain Affordability
Affordability can change quickly, but policy decisions can protect it. The NLC highlights several approaches:
- Tax Increment Financing (TIF) for Housing: Salt Lake City directs 10% of new TIF revenue to a housing trust, creating a steady funding source for affordable projects.
- Community Benefit Agreements (CBAs): Nashville’s stadium development deal requires 16% of new housing to be income-restricted, ensuring major projects contribute to affordability.
- Inclusionary Zoning: New York City mandates that a portion of new housing be permanently affordable, encouraging mixed-income neighborhoods.
- Density Bonuses: Philadelphia lets developers build larger projects if they contribute to an affordable housing fund, tying new growth to affordability funding.
Risk & Opportunity Matrix
The future of rental affordability in the U.S. will depend on several major forces that influence each other. This matrix summarizes the main national risks that could reduce affordability and the opportunities that could improve it.
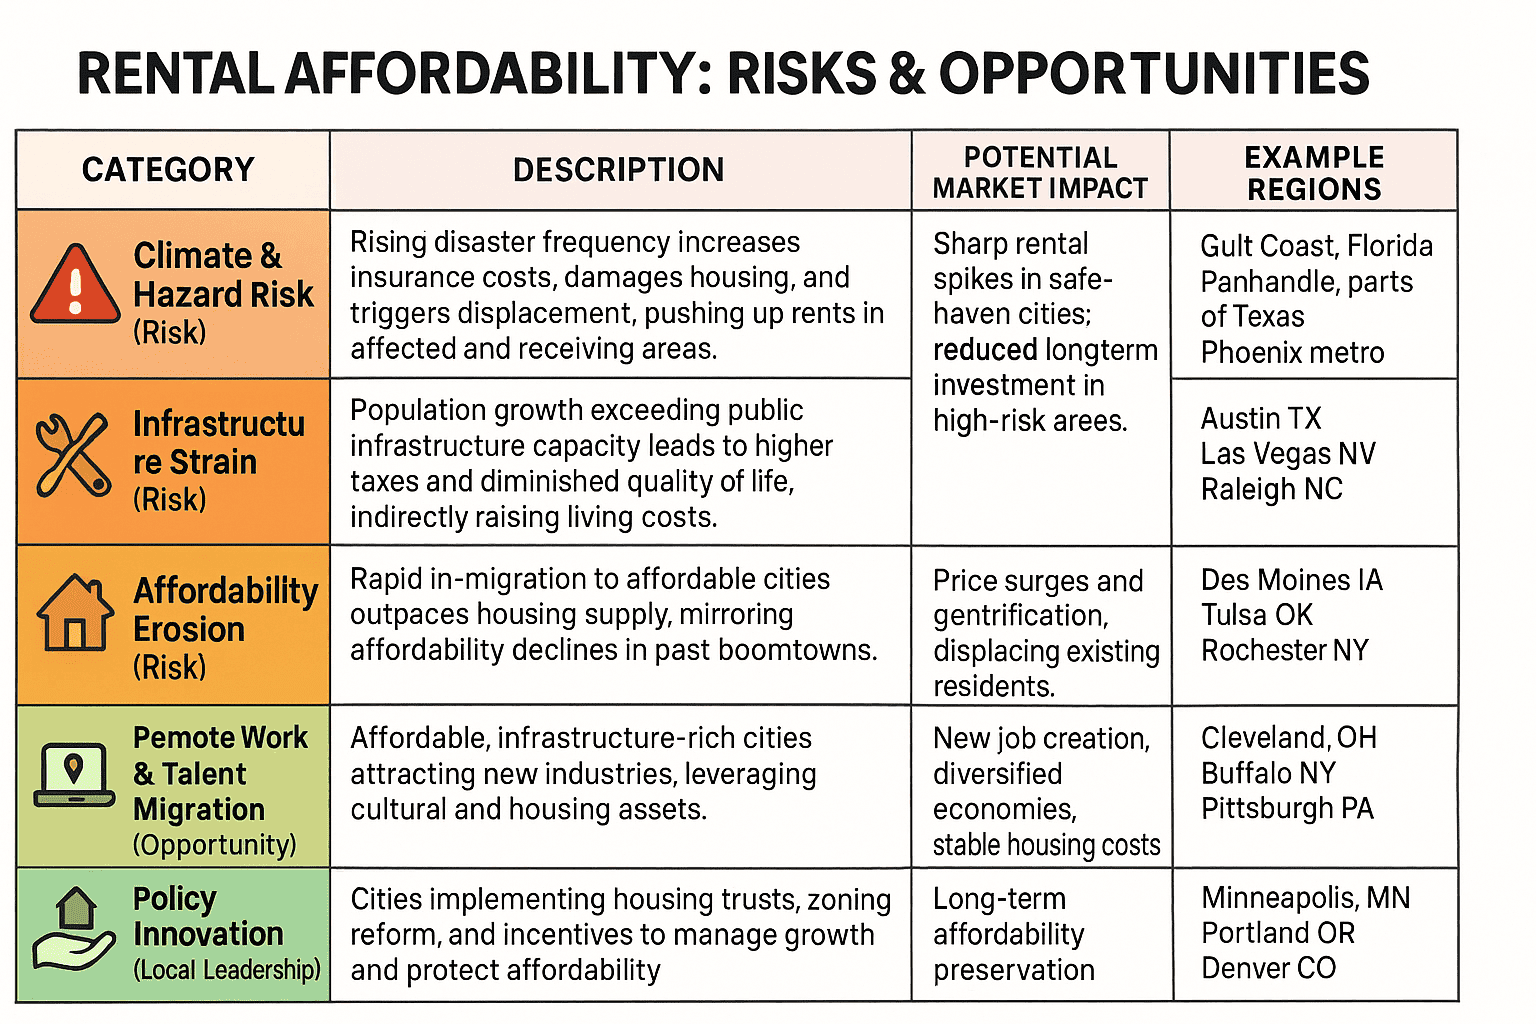
rental affordability matrix
Projection Logic
The model established a 2023 baseline rent-to-income ratio for each MSA. It projected rent to 2030 using a growth rate based on a weighted average of historical trends, current market speed, and supply and demand pressures. It used a similar process to project renter income, starting with a historical growth rate and adjusting it with the CBO’s national macroeconomic forecast.
Assumptions and Limitations:
The model assumes that historical trends in local income growth and housing supply responsiveness will continue, though moderated by national economic conditions. It does not account for unexpected local economic shocks, such as the closure of a major employer, or major changes in local housing policy, such as the sudden start of rent control.
All projections have uncertainty, which grows over longer time spans. These rankings are a data-driven forecast based on current trends and known variables, not a guarantee of future conditions.
Categorised in: Market Insights
This post was written by Julia Novakovich
Julia Novakovich is a housing researcher and writer at Market Apartments. She analyzes affordability trends, income-to-price forecasts, and regional migration patterns to uncover data-backed stories about how and where Americans live. Her work helps renters, buyers, and local media understand upcoming housing trends.