
September 16, 2025 4:28 pm Leave your thoughts
In 2024, nearly half of all American renter households were considered cost-burdened, spending over 30% of their income on housing. The figure signals structural weakness in the housing market and points to a decade of major shifts in where Americans can afford to live.
Executive summary: key findings and projections for 2030
The report provides a forward-looking analysis of U.S. housing affordability and identifies the metropolitan areas best positioned to maintain affordable homeownership by 2030. Using a proprietary forecasting model based on federal economic and housing data, the analysis projects home prices and incomes to calculate a 2030 affordability ratio for major U.S. cities. The projections show a widening divide for future homebuyers across the nation.
• The critical affordability ratio: The most affordable U.S. cities in 2030 are projected to have a median home price-to-median household income ratio between 3.5 and 4.5. Ratios of 8.0 or higher are expected to persist in the most expensive coastal and Sun Belt markets, showing a growing geographic divide in economic opportunity.
• Geographic concentration in the American Heartland: Most of the top 10 affordable cities are in the Midwest and the Rust Belt. These regions show moderate but steady economic growth, manageable population trends, and a large housing stock that absorbs demand without the price shocks seen in other markets.
• Top-ranked metro area: Pittsburgh, Pennsylvania, is projected to be the most affordable large metropolitan area in the U.S. by 2030. Its affordability rests on a diversified economy in healthcare and technology and a home price growth path that is not expected to outpace modest, steady wage gains.
• The core driver of long-term affordability: The analysis finds that affordability in the next decade will depend not only on low home prices, but on the balance between local wage growth and the pace of home price increases.
American incomes can no longer keep pace with housing costs
American homeownership faces unprecedented strain. For decades, buying a home was a cornerstone of economic mobility, but a structural gap has emerged between American incomes and housing costs. This shift is not a temporary market fluctuation but a structural decoupling, driven by long-term economic forces that have reshaped housing costs nationwide.
The scale of the crisis appears in recent figures. As of mid-2025, the median sale price for a home in the United States stood at approximately $440,910, according to data from Redfin. In parallel, the most recent multi-year estimates from the Census Bureau place the median household income at $78,538. This creates a national home price-to-income ratio of 5.6, nearly double the traditional affordability benchmark of 3.0, a standard long used by lenders and financial planners.
The ratio directly affects millions of American households. The U.S. Department of Housing and Urban Development defines households that spend more than 30% of gross income on housing costs as “cost-burdened.” By this measure, the nation is failing a significant portion of its population. Census Bureau data analyzed by Pew Research Center found that in 2023, nearly half (49.7%) of all renter households in the U.S. were cost-burdened, with many spending over 50% of their income on rent, a condition classified as “severe cost burden.” Widespread rental unaffordability limits a household’s ability to save for a down payment, leaving a generation of potential buyers unable to move beyond renting.
The root causes: a deficit of homes and a surplus of demand
A chronic and worsening housing shortage drives the widening gap between prices and incomes. Decades of underbuilding, particularly after the 2008 financial crisis, created a fundamental imbalance between supply and demand. Research from Zillow estimates that the national housing deficit reached 4.7 million homes in 2023, and the shortfall continues to grow.
The gap is most severe for entry-level homes. Census Bureau data show that construction of single-family homes under 1,400 square feet fell from 186,000 units in 2004 to 87,000 in 2023. The scarcity of starter homes forces first-time buyers to compete for a shrinking pool of affordable properties, which drives up prices and stretches their finances.
The supply crunch is compounded by a market condition known as the lock-in effect. Mortgage rates below 4 percent between 2020 and early 2022 allowed millions of homeowners to buy or refinance at historically low levels. With current rates near 7 percent, these households are financially disincentivized from selling and taking on a higher-rate loan. The National Association of Realtors identifies the lock-in effect as a primary driver of reduced housing inventory, since it keeps homes off the market that would otherwise be for sale.
If the Federal Reserve lowers rates significantly, it could release a surge of inventory from homeowners who have been previously locked in. A sudden increase in supply might briefly improve conditions for buyers. Still, it could also create price volatility that complicates long-term planning for both buyers and sellers who have adjusted to a market shaped by scarcity.
A structural problem, not a cyclical blip
An analysis of long-term economic forecasts shows that the current affordability crisis is not a temporary peak in a real estate cycle but the result of a structural divergence of asset price inflation from wage growth. This conclusion rests on evidence from the nation’s foremost economic and budgetary authorities.
Historical data from Zillow and Redfin confirm that home price growth has far outpaced wage gains over the past decade, a period that included both expansion and recession. The persistence of the trend across different cycles shows that it is resilient to short-term conditions.
Second, the Congressional Budget Office, in its long-term outlook, projects slower real economic growth for the United States, averaging 1.8 percent per year through 2035. The CBO also expects slower labor force growth, a key driver of overall expansion. Weaker economic and labor force growth makes it unlikely that aggregate real wages will rise fast enough to close the affordability gap.
When these two factors are combined, the long-term picture becomes clear. If home prices continue to rise at long-term historical averages, a conservative assumption given the persistent housing supply deficit, while real income growth remains constrained by slower macroeconomic expansion, the gap between home prices and incomes is certain to widen at the national level. This structural reality makes identifying the few metropolitan areas that can defy the national trend a critical exercise for Americans seeking homeownership in the coming decade.
2030 outlook and affordability frontier
To identify U.S. cities most likely to support stable homeownership by the end of the decade, the report developed a multi-step forecasting model. The model synthesizes data from government and private-sector sources to project a 2030 Affordability Ratio, defined as the ratio of a metropolitan area’s median home price to its median household income. This forward-looking metric offers a more robust measure of future affordability than a snapshot of current prices.
Forecasting method: a transparent path to 2030 rankings
The credibility of a forecast rests on the transparency of its method. The following steps were taken to generate the 2030 affordability rankings, using conservative, data-backed assumptions at each stage.
Step 1: Candidate pool selection.
The analysis began with a pool of 50 large U.S. Metropolitan Statistical Areas (MSAs). This step matters because MSAs include the core city and surrounding suburbs, which gives a fuller picture of a region’s housing market and economy than city-limit data alone. The pool included affordable markets in the Midwest, South, and Rust Belt, along with high-cost coastal and Sun Belt markets used as benchmarks for comparison.
Step 2: Projecting 2030 Median Home Prices.
- Baseline data: Current (2025) median home sale prices for each MSA were established using a blended average of recent data from Redfin and the Zillow Home Value Index. This created a baseline that reflects both recent sales and overall market value.
- Growth rate: A national home price appreciation rate of 3.5 percent per year was applied. Estimates from the National Association of Realtors and Fannie Mae project long-term growth of 2 to 5 percent through the decade. This annual rate was compounded over five years to calculate the projected 2030 median home price for each MSA. Some local markets will outperform or fall short of the national average, but applying a consistent conservative rate avoids speculative assumptions and keeps the focus on relative affordability, based on current prices and projected income growth.
Step 3: Projecting 2030 median household income
- Baseline data: The median household income for 2023–2024 in each MSA was obtained from the American Community Survey, which provides the most detailed local income data.
- Growth rate: The baseline nominal income growth rate was set at 3.8% per year. It combines two federal projections: the Congressional Budget Office’s long-term forecast for real economic growth of about 1.8% annually and the Federal Reserve’s long-run inflation target of 2.0%. The rate was compounded over five years to project 2030 median household income for each MSA.
Step 4: Calculating the 2030 affordability ratio. For each MSA, the projected 2030 median home price was divided by the projected 2030 median household income. The resulting ratio served as the ranking metric.
Step 5: Ranking. MSAs were ordered from the lowest (most affordable) to the highest (least affordable) 2030 affordability ratio to produce the final top 10 list.
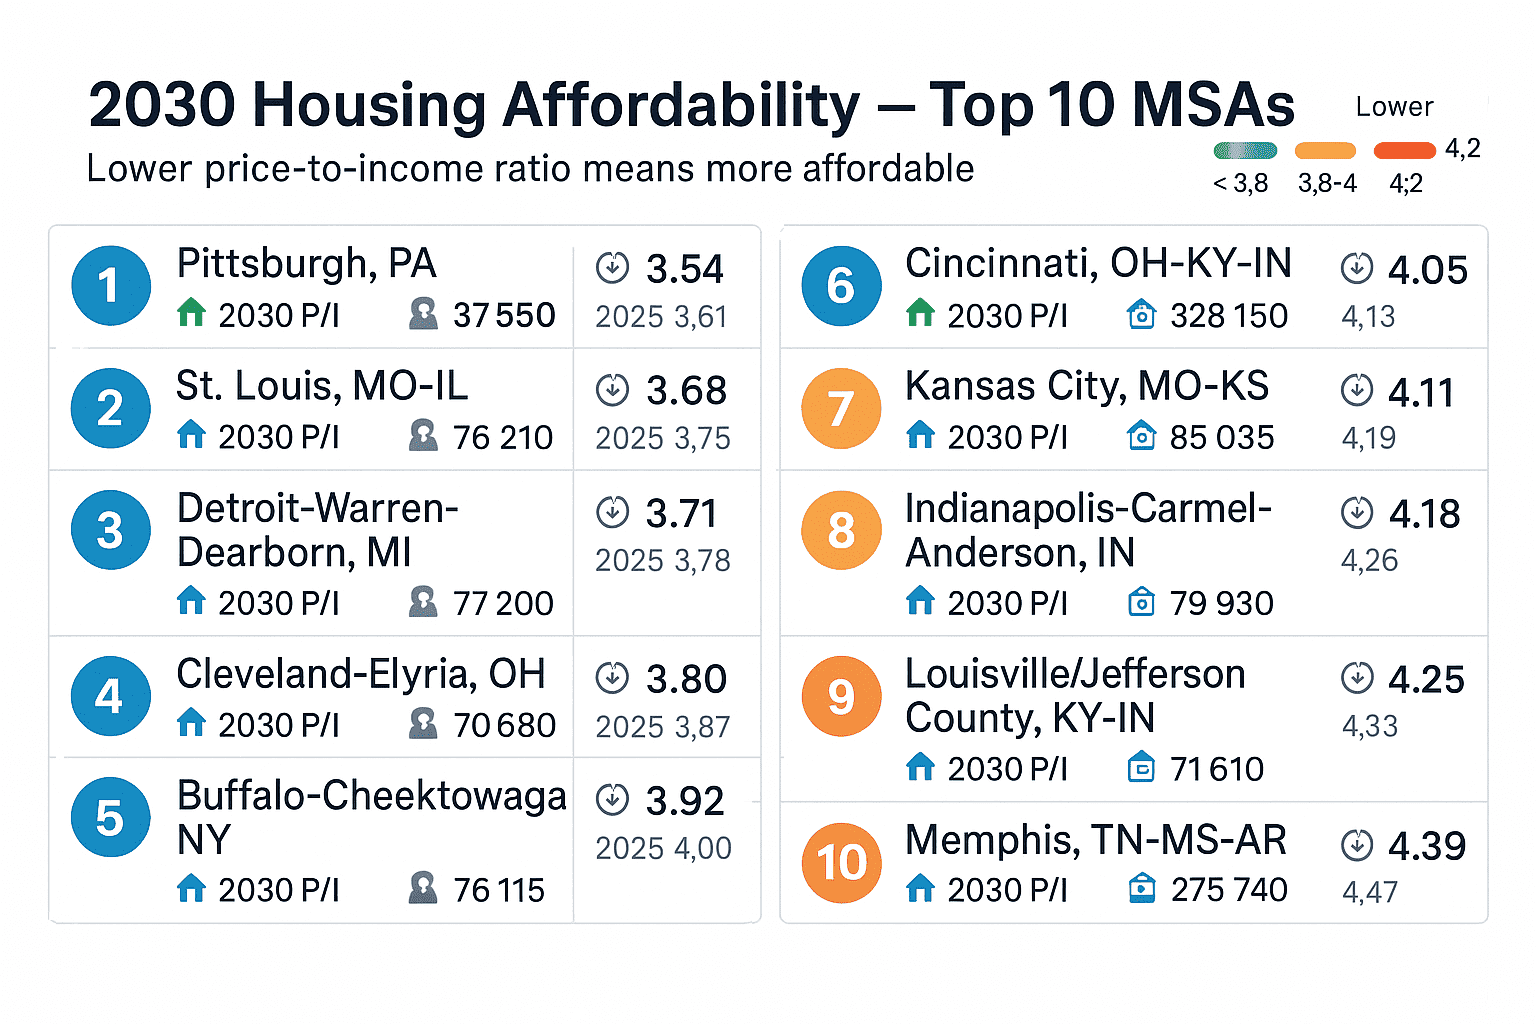
Full ranking: America’s 10 most affordable cities in 2030
The table below shows the results of the forecasting analysis, ranking the 10 U.S. metropolitan areas expected to have the most favorable balance between home prices and household incomes by 2030. It combines several datasets into one ranking that looks ahead to 2030. Comparing the 2030 ratio with the 2025 ratio shows the likely direction of affordability in each market.
A closer look at the top 5 most affordable metros
Data from multiple studies show a consistent pattern. The cities positioned for future affordability combine a legacy of accessible housing with economies that expand steadily without overheating. Below are detailed profiles of the top five metropolitan areas.
- Pittsburgh, Pennsylvania
Pittsburgh is projected to be the most affordable large metro in 2030, reflecting its economic reinvention and moderate growth. In 2025, its median home price is about $230,000 and median household income is around $68,000, according to estimates from the Census Bureau. The job market has shifted from heavy industry to a stable base in healthcare through UPMC, education through Carnegie Mellon University and the University of Pittsburgh, and technology. - St. Louis, Missouri-Illinois
The St. Louis metropolitan area ranks high because of low housing costs and a stable economy. Its projected 2030 affordability ratio is 3.68. A large stock of existing housing helps keep prices in check. The economy is diversified across healthcare, financial services, and aerospace, which provides a resilient base of employment. The region does not match the rapid job creation of coastal tech hubs, but its stability keeps wage growth close to housing cost trends. Its central location and role as a transportation hub create an economic floor that protects it from the extremes of other regions.3. Detroit-Warren-Dearborn, Michigan
Detroit, once the symbol of industrial decline, is reemerging as a leader in affordability. The transformation rests on low housing costs and a revitalized economy. While still anchored by the automotive industry, the region has diversified into advanced manufacturing, engineering, and technology. This evolution supports more sustainable wage growth. Years of population decline left a surplus of housing. Although the city core has seen reinvestment and rising prices, the broader metro continues to offer some of the nation’s most affordable homes.If growth stays steady and avoids speculative spikes, Detroit can maintain a pathway to homeownership that is increasingly rare in much of the country. This revitalization creates a test for local leaders. They must decide whether to prioritize rapid growth, which could raise the tax base but displace long-term residents, or to manage growth through policies that preserve affordability. That choice will shape the city’s character for decades.
4. Cleveland-Elyria, Ohio
Cleveland ranks high because of deep affordability and an economy rooted in non-cyclical industries. The metro’s housing market is among the least expensive in large U.S. cities. Healthcare, led by the Cleveland Clinic, along with biomedical research and manufacturing, provide stable jobs that are less exposed to swings in the national business cycle. Population growth is projected to be modest, which helps balance supply and demand. That balance prevents a hyper-competitive market and keeps home prices aligned with local incomes.5. Buffalo-Cheektowaga, New York
Buffalo, with a projected 2030 affordability ratio of 3.92, combines low home prices with a diversifying economy. Its location near the Canadian border and legacy of manufacturing support strengths in advanced manufacturing, life sciences, and logistics. Recent public and private investment has revitalized parts of the city, drawing new residents and businesses without driving runaway inflation. A large housing stock, tied to its industrial past, serves as a buffer against demand pressures. For homebuyers priced out of major East Coast metros, Buffalo offers urban amenities and a path to homeownership at a fraction of the cost. The main challenge will be managing new demand while preserving long-term affordability.Structural shifts in demographics and economics
Housing affordability in 2030 will reflect broader economic and demographic shifts. It will result from long-term changes in American demographics and economic geography. Two factors will drive where homeownership remains attainable: population migration and the distribution of job growth across the country.
Population migration and housing demand
For decades, American migration has moved toward the coasts and the Sun Belt. Population projection data from the Iowa Data Center and research from the University of Virginia’s Weldon Cooper Center show that this trend will continue, with the South and West expected to capture most population growth through 2030 Iowa Data Center. A more complex pattern is emerging within this larger shift. Census data shows significant domestic out-migration from the most expensive and densely populated metropolitan areas, especially in California and the Northeast.
While these areas continue to grow through international migration and natural increase, the outflow of domestic residents shows that many households have reached a financial limit. This pattern creates a two-tier system of population movement.
High-cost, high-pressure markets
States such as California and Hawaii, and their major metropolitan areas, are projected to remain highly unaffordable, with home prices requiring large income gains to support. Sun Belt cities in states such as Florida, Texas, and Arizona, which once provided an affordable alternative, now face rising demand that is eroding their cost advantage.
Reports from the U.S. Conference of Mayors and Oxford Economics forecast that cities such as Austin, Phoenix, Orlando, and Dallas will lead the nation in GDP and job growth, which will raise housing demand and prices.
Pressure release valve markets
Intense demand in the Sun Belt positions more stable, slower-growing metropolitan areas of the Midwest and parts of the industrial Southeast as the nation’s likely pressure release valves. These cities, identified in the report’s top 10 ranking, combine economic opportunity with housing access that is diminishing elsewhere.
As remote and hybrid work continues, more households will relocate to these lower-cost regions to escape the financial strain of the nation’s major economic hubs. This migration carries both benefits and risks. It can bring new workers and economic growth, but it may also import the same housing stress that new residents are leaving behind.
If municipal governments in these cities fail to upgrade aging infrastructure, growth could reduce the quality of life and leave affordability tied to weakened public services. Local governments must decide whether to raise taxes on existing residents to fund upgrades or accept service decline that may eventually drive households away.
The job corridor effect and housing affordability
Beyond population size, the quality and type of economic growth determine long-term housing affordability. Data show that the most affordable cities in 2030 will have diverse economies and avoid reliance on a single volatile sector such as technology, which drives rapid wage and housing price growth that benefits a few but excludes most households.
The “Job Corridor Effect” appears when comparing different economic models. Metropolitan areas such as San Francisco and San Jose report some of the nation’s highest median household incomes, yet they remain among the least affordable housing markets. Their economies are concentrated in high-paying technology jobs, creating a feedback loop in which high salaries allow part of the workforce to bid up home prices, moving the market out of reach for teachers, service workers, and other lower-paid professions. The concentration of wealth drives housing price inflation beyond what the median household can support.
Cities projected to remain more affordable by 2030, including Pittsburgh, St. Louis, and Cleveland, have more diversified economies. Their job markets rely on stable sectors such as healthcare, advanced manufacturing, education, and logistics. These industries generate moderate, broad-based, and stable wage growth. That structure reduces income gaps and limits speculative housing bubbles.
Housing in these older cities is often cheaper but comes with hidden costs. Many homes predate modern building codes and may require costly upgrades to electrical systems, plumbing, and insulation. These expenses are not reflected in sale prices but add to ownership costs for new buyers.
The ideal affordable city in 2030 will have a balanced economy, not overheated enough to spark speculation and not stagnant enough to stall growth. Such a market supports steady employment and gradual wage growth across sectors, keeping housing appreciation in line with the median household’s income. That balance will shape housing affordability through the next decade.
Implications for homebuyers, investors, and policymakers
The diverging paths of U.S. housing markets carry significant implications for all stakeholders. The projections in this report point to a series of important decisions and tradeoffs that will shape American housing for years to come. For homebuyers, investors, and city officials, the next five years mark a decisive period for action.
For homebuyers: equity and risk
For prospective homebuyers, the findings highlight a tradeoff likely to dominate the next decade, between near-term affordability and the potential for long-term wealth creation. Buying in a projected affordable city such as Pittsburgh or Detroit may lower the barrier to entry and reduce the monthly mortgage payment.
That financial relief may come with slower home price appreciation than in high-demand, fast-growing markets. Households must decide whether their priority is stable housing within budget or maximizing the investment potential of their property. Neither choice is inherently right or wrong, but the distinction matters.
Emerging risks not captured in traditional affordability metrics further complicate this decision. Homebuyers relocating to historically stable regions must assess both climate and infrastructure risk. A city’s affordability can erode quickly due to rising insurance premiums in areas facing greater flood or wildfire risk, according to data from First Street Foundation.
Cities with decades of deferred infrastructure maintenance may need to raise property taxes to fund upgrades, adding an unexpected financial burden for homeowners. Prospective buyers must look beyond the sale price and weigh the long-term resilience of the community, a due diligence process now as important as a home inspection.
Risk and opportunity matrix: U.S. housing market to 2030
Opportunities
- Expansion of hybrid and remote work: Greater acceptance of remote work will untether many high-wage jobs from high-cost regions. Skilled workers can relocate to more affordable cities, strengthening local economies.
- Proactive zoning and land use reform: Cities can reduce the risk of an affordability crisis by revising restrictive zoning codes, such as ending single-family-only rules and allowing higher density near transit. These reforms would support a more diverse and affordable housing supply.
- Federal infrastructure investment: Programs such as the Bipartisan Infrastructure Law create opportunities for cities to secure funding for major projects that support growth, improve quality of life, and strengthen long-term competitiveness.
- Demographic tailwinds: Millennial and Gen Z households are entering their prime home buying years, creating sustained demand for housing through the next decade. Starter homes in affordable regions are likely to see the strongest demand.
Risks
- Climate change and insurance costs: More frequent and severe floods, wildfires, and storms will drive up property insurance premiums. Homes in high-risk areas may become unaffordable even if sale prices remain low. This could trigger market corrections in vulnerable Sun Belt and coastal regions.
- Infrastructure strain in growth cities: Rapid population growth in lower-cost cities will strain aging infrastructure such as roads, water systems, and schools. Meeting these needs will require significant tax increases to fund upgrades and prevent a decline in quality of life, measures that may face public resistance.
- Federal policy and interest rate volatility: Unpredictable changes in federal policy, such as adjustments to the mortgage interest deduction or expiration of the 2017 Tax Cuts and Jobs Act, could shift household finances. Persistent inflation may also prompt the Federal Reserve to maintain higher interest rates for a longer period, thereby slowing housing demand.
- Construction labor and material shortages: Shortages of skilled workers and unstable building material supply chains could prevent affordable cities from building new housing fast enough to meet rising demand, even if zoning laws become more flexible.
Categorised in: Market Insights
This post was written by Julia Novakovich
Julia Novakovich is a housing researcher and writer at Market Apartments. She analyzes affordability trends, income-to-price forecasts, and regional migration patterns to uncover data-backed stories about how and where Americans live. Her work helps renters, buyers, and local media understand upcoming housing trends.